7 Dados qualitativos: mapa corocromático ordinal
Mapas corocromáticos ordinais são usados para representar dados qualitativos que se ordenam. Esses dados podem ser derivados de dados quantitativos para os quais se atribuem classes ordenadas do tipo “baixo-médio-alto”, “ruim-regular-bom” ou outras que sigam esta lógica.
O exemplo usado aqui é o do mapa de potencial de agressividade climática na Amazônia Legal do Brasil, elaborado pela Coordenação de Recursos Naturais e Estudos Ambientais - CREN, da Diretoria de Geociências do IBGE. São três classes: alta (fatores 1 e 2), média (fatores 1, 2 e 3) e baixa (fatores 1, 2 e 3). Aqui, Fator é a causa predominante que explica o potencial de agressividade do clima: os fatores determinantes que explicam cada grau, expressos pelos dígitos 1, 2 e 3, que representam, respectivamente o Excesso de Umidade, a Deficiência de Umidade e a Ocorrência de Ambos Fatores (http://geoftp.ibge.gov.br/cartas_e_mapas/mapas_regionais/sociedade_e_economia/integrado_zee_amazonia_legal/Potencial_de_Agressividade_Climatica.pdf).
A ideia é seguir as cores segundo classe (alta, média e baixa) com variações de tonalidade dentro de cada classe.
7.1 Banco de dados
Iniciamos limpando a memória.
Definimos o diretório de trabalho.
Carregamos os pacotes que serão utilizados.
#para carregar os pacotes que serao usados
library(geobr)
library(sf)
library(rgdal)
library(ggplot2,warn.conflicts=FALSE)
library(dplyr)
library(ggsn)
library(cowplot)
library(ggspatial)
library(broom)
library(rnaturalearth)
library(rnaturalearthdata)
Vamos criar o objeto mundo usando a função ne_countries do pacote rnaturalearth.
Vamos examinar o objeto gerado.
## Simple feature collection with 6 features and 63 fields
## Geometry type: MULTIPOLYGON
## Dimension:     XY
## Bounding box:  xmin: -70.06611 ymin: -18.01973 xmax: 74.89131 ymax: 60.40581
## Geodetic CRS:  +proj=longlat +datum=WGS84 +no_defs +ellps=WGS84 +towgs84=0,0,0
##   scalerank      featurecla labelrank     sovereignt sov_a3 adm0_dif level
## 0         3 Admin-0 country         5    Netherlands    NL1        1     2
## 1         1 Admin-0 country         3    Afghanistan    AFG        0     2
## 2         1 Admin-0 country         3         Angola    AGO        0     2
## 3         1 Admin-0 country         6 United Kingdom    GB1        1     2
## 4         1 Admin-0 country         6        Albania    ALB        0     2
## 5         3 Admin-0 country         6        Finland    FI1        1     2
##                type       admin adm0_a3 geou_dif     geounit gu_a3 su_dif     subunit su_a3
## 0           Country       Aruba     ABW        0       Aruba   ABW      0       Aruba   ABW
## 1 Sovereign country Afghanistan     AFG        0 Afghanistan   AFG      0 Afghanistan   AFG
## 2 Sovereign country      Angola     AGO        0      Angola   AGO      0      Angola   AGO
## 3        Dependency    Anguilla     AIA        0    Anguilla   AIA      0    Anguilla   AIA
## 4 Sovereign country     Albania     ALB        0     Albania   ALB      0     Albania   ALB
## 5           Country       Aland     ALD        0       Aland   ALD      0       Aland   ALD
##   brk_diff        name     name_long brk_a3    brk_name brk_group abbrev postal
## 0        0       Aruba         Aruba    ABW       Aruba      <NA>  Aruba     AW
## 1        0 Afghanistan   Afghanistan    AFG Afghanistan      <NA>   Afg.     AF
## 2        0      Angola        Angola    AGO      Angola      <NA>   Ang.     AO
## 3        0    Anguilla      Anguilla    AIA    Anguilla      <NA>   Ang.     AI
## 4        0     Albania       Albania    ALB     Albania      <NA>   Alb.     AL
## 5        0       Aland Aland Islands    ALD       Aland      <NA>  Aland     AI
##                      formal_en formal_fr note_adm0 note_brk   name_sort name_alt mapcolor7
## 0                        Aruba      <NA>     Neth.     <NA>       Aruba     <NA>         4
## 1 Islamic State of Afghanistan      <NA>      <NA>     <NA> Afghanistan     <NA>         5
## 2  People's Republic of Angola      <NA>      <NA>     <NA>      Angola     <NA>         3
## 3                         <NA>      <NA>      U.K.     <NA>    Anguilla     <NA>         6
## 4          Republic of Albania      <NA>      <NA>     <NA>     Albania     <NA>         1
## 5                Åland Islands      <NA>      Fin.     <NA>       Aland     <NA>         4
##   mapcolor8 mapcolor9 mapcolor13  pop_est gdp_md_est pop_year lastcensus gdp_year
## 0         2         2          9   103065     2258.0       NA       2010       NA
## 1         6         8          7 28400000    22270.0       NA       1979       NA
## 2         2         6          1 12799293   110300.0       NA       1970       NA
## 3         6         6          3    14436      108.9       NA         NA       NA
## 4         4         1          6  3639453    21810.0       NA       2001       NA
## 5         1         4          6    27153     1563.0       NA         NA       NA
##                      economy              income_grp wikipedia fips_10 iso_a2 iso_a3 iso_n3
## 0       6. Developing region 2. High income: nonOECD        NA    <NA>     AW    ABW    533
## 1  7. Least developed region           5. Low income        NA    <NA>     AF    AFG    004
## 2  7. Least developed region  3. Upper middle income        NA    <NA>     AO    AGO    024
## 3       6. Developing region  3. Upper middle income        NA    <NA>     AI    AIA    660
## 4       6. Developing region  4. Lower middle income        NA    <NA>     AL    ALB    008
## 5 2. Developed region: nonG7    1. High income: OECD        NA    <NA>     AX    ALA    248
##   un_a3 wb_a2 wb_a3 woe_id adm0_a3_is adm0_a3_us adm0_a3_un adm0_a3_wb     continent
## 0   533    AW   ABW     NA        ABW        ABW         NA         NA North America
## 1   004    AF   AFG     NA        AFG        AFG         NA         NA          Asia
## 2   024    AO   AGO     NA        AGO        AGO         NA         NA        Africa
## 3   660  <NA>  <NA>     NA        AIA        AIA         NA         NA North America
## 4   008    AL   ALB     NA        ALB        ALB         NA         NA        Europe
## 5   248  <NA>  <NA>     NA        ALA        ALD         NA         NA        Europe
##   region_un       subregion                 region_wb name_len long_len abbrev_len tiny
## 0  Americas       Caribbean Latin America & Caribbean        5        5          5    4
## 1      Asia   Southern Asia                South Asia       11       11          4   NA
## 2    Africa   Middle Africa        Sub-Saharan Africa        6        6          4   NA
## 3  Americas       Caribbean Latin America & Caribbean        8        8          4   NA
## 4    Europe Southern Europe     Europe & Central Asia        7        7          4   NA
## 5    Europe Northern Europe     Europe & Central Asia        5       13          5    5
##   homepart                       geometry
## 0       NA MULTIPOLYGON (((-69.89912 1...
## 1        1 MULTIPOLYGON (((74.89131 37...
## 2        1 MULTIPOLYGON (((14.19082 -5...
## 3       NA MULTIPOLYGON (((-63.00122 1...
## 4        1 MULTIPOLYGON (((20.06396 42...
## 5       NA MULTIPOLYGON (((20.61133 60...
Observe que o CRS de mundo é WGS84. Na sequência, baixamos o arquivo “BR_UF_2020.zip” que contém o shapefile dos limites estaduais do Brasil, do site do IBGE.
#para identificar o url, faca o download do arquivo shapefile e clique em Ctrl+J
download.file(url = "https://geoftp.ibge.gov.br/organizacao_do_territorio/malhas_territoriais/malhas_municipais/municipio_2020/Brasil/BR/BR_UF_2020.zip",        destfile = "BR_UF_2020.zip")
Precisamos descompactar o arquivo tipo zip.
Fazemos a leitura do arquivo shapefile no R. O arquivo receberá o nome de UFBR.
## Reading layer `BR_UF_2020' from data source
##   `C:\Users\l_viz\Documents\RCartoTematica\BR_UF_2020.shp' using driver `ESRI Shapefile'
## Simple feature collection with 27 features and 4 fields
## Geometry type: MULTIPOLYGON
## Dimension:     XY
## Bounding box:  xmin: -73.99045 ymin: -33.75118 xmax: -28.84764 ymax: 5.271841
## Geodetic CRS:  SIRGAS 2000
A função head fornece uma série de informações, tais como os limites e o CRS.
## Simple feature collection with 6 features and 4 fields
## Geometry type: MULTIPOLYGON
## Dimension:     XY
## Bounding box:  xmin: -73.99045 ymin: -13.6937 xmax: -46.06142 ymax: 5.271841
## Geodetic CRS:  SIRGAS 2000
##   CD_UF    NM_UF SIGLA_UF NM_REGIAO                       geometry
## 1    11 Rondônia       RO     Norte MULTIPOLYGON (((-65.3815 -1...
## 2    12     Acre       AC     Norte MULTIPOLYGON (((-71.07772 -...
## 3    13 Amazonas       AM     Norte MULTIPOLYGON (((-69.83766 -...
## 4    14  Roraima       RR     Norte MULTIPOLYGON (((-63.96008 2...
## 5    15     Pará       PA     Norte MULTIPOLYGON (((-51.43248 -...
## 6    16    Amapá       AP     Norte MULTIPOLYGON (((-50.45011 2...
Observe que o CRS é SIRGAS 2000. Para ver a unidade de medida do arquivo UFBR.
## [1] "degree"Vamos solicitar a visualização das colunas de UFBR.

Para saber o tipo de dados de UFBR, usamos a função class.
## [1] "sf" "data.frame"A segunda camada shapefile que precisamos é a de potencial de agressividade climática na Amazônia, que se encontra no site do IBGE.
#para fazer o download do arquivo da Amazônia
download.file(url = "https://geoftp.ibge.gov.br/informacoes_ambientais/climatologia/vetores/regionais/shapes_potencial_agressividade_climatica.zip",
              destfile = "shapes_potencial_agressividade_climatica.zip")
Usamos a função já conhecida para descompactar o arquivo.
E fazemos a leitura do shapefile no R, já atribuindo a projeção SIRGAS 2000 (CRS = 4674).
#para abrir o arquivo shapefile da Amazonia
amazonia <- st_read("./VetoresIntegrados.shp", crs = 4674)
## Reading layer `VetoresIntegrados' from data source
## `C:\Users\l_viz\Documents\RCartoTematica\VetoresIntegrados.shp' using driver `ESRI Shapefile'## Warning: st_crs<- : replacing crs does not reproject data; use st_transform for that## Simple feature collection with 454 features and 2 fields
## Geometry type: POLYGON
## Dimension: XY
## Bounding box: xmin: -73.99853 ymin: -18.04267 xmax: -43.98264 ymax: 5.277829
## Geodetic CRS: SIRGAS 2000Damos uma olhada nos limites, colunas e projeção do arquivo.
## Simple feature collection with 6 features and 2 fields
## Geometry type: POLYGON
## Dimension:     XY
## Bounding box:  xmin: -65.35683 ymin: -18.04267 xmax: -50.22443 ymax: -9.736471
## Geodetic CRS:  SIRGAS 2000
##   Id Classe                       geometry
## 1  0     A2 POLYGON ((-51.72783 -15.548...
## 2  0     A2 POLYGON ((-58.00463 -15.393...
## 3  0     M2 POLYGON ((-59.98223 -11.944...
## 4  0     B2 POLYGON ((-61.47633 -10.528...
## 5  0     M2 POLYGON ((-50.22443 -9.8380...
## 6  0     B2 POLYGON ((-50.37933 -9.8277...
Podemos visualizar o shapefile “amazonia” (Figura 7.1).
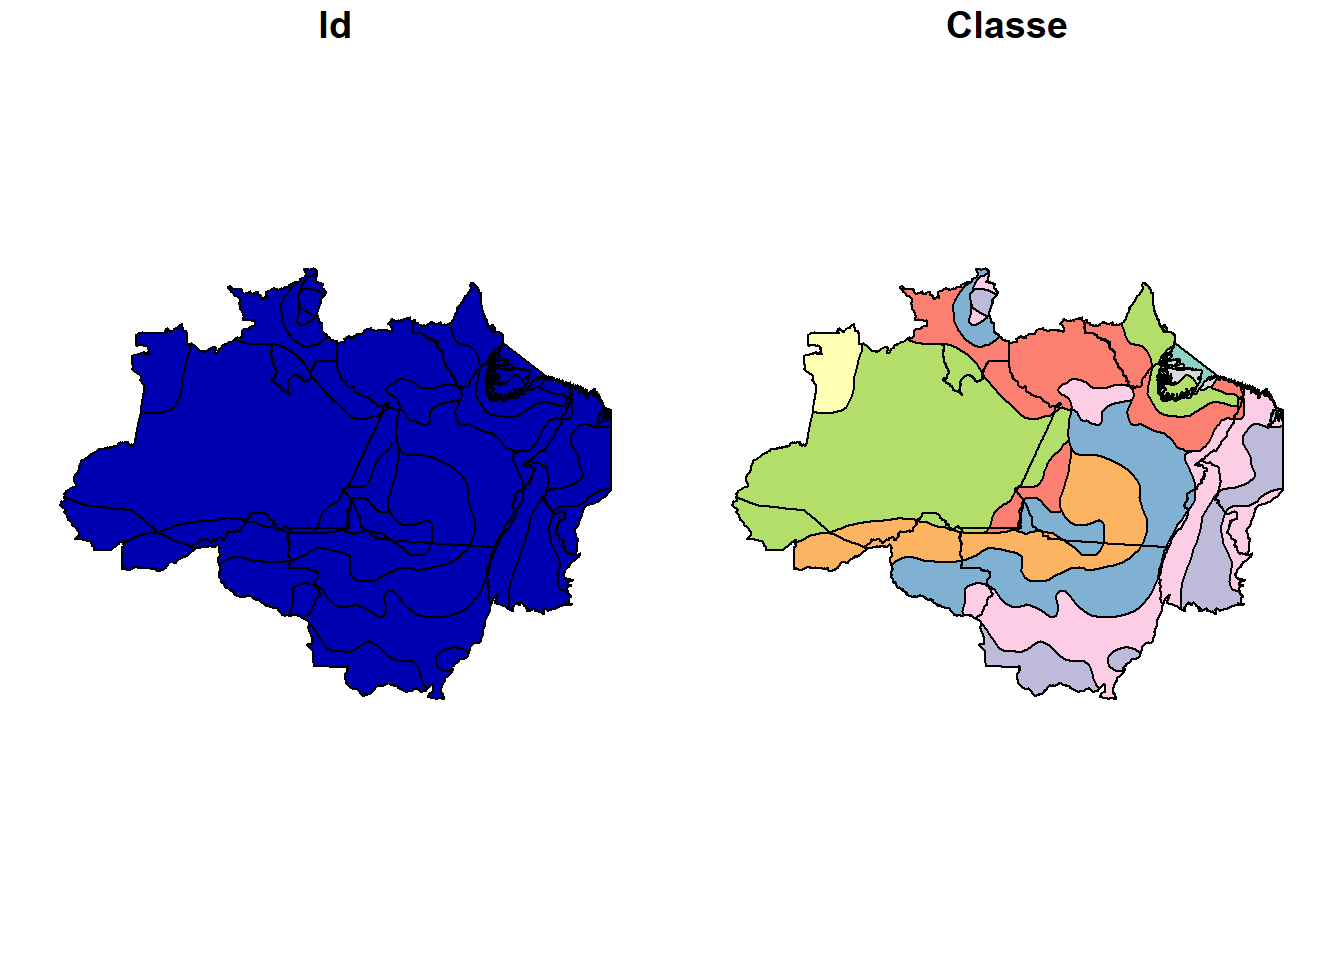
Figure 7.1: Mapa para cada coluna da tabela de dados
Os objetos que iremos utilizar estão em projeções diferentes: mundo (CRS = WGS84), amazonia e UFBR (CRS = SIRGAS 2000). Como estas projeções são compatíveis, vamos mantê-las como estão.
7.2 Potencial de agressividade climática na Amazônia Legal do Brasil
Vamos iniciar a elaboração do mapa usando o ggplot2. A primeira camada a ser mapeada será mundo. Como um objeto de classe sf, usaremos a função geom_sf, indicando a cor do contorno (“white”, branco) e do preenchimento (“grey90”, cinza claro) (Figura 7.2).
Figure 7.2: Mapa-mundi
A segunda camada será a dos limites dos estados brasileiros (UFBR), com contorno em cinza médio (grey50) e preenchimento em cinza mais claro do que o contorno (grey85) e leve transparência (alpha = 0.2) (Figura 7.3).
ggplot() +
geom_sf(data = mundo, colour = "white", fill = "grey90")+
geom_sf(data = UFBR, colour = "grey50", fill = "grey85", alpha = 0.2)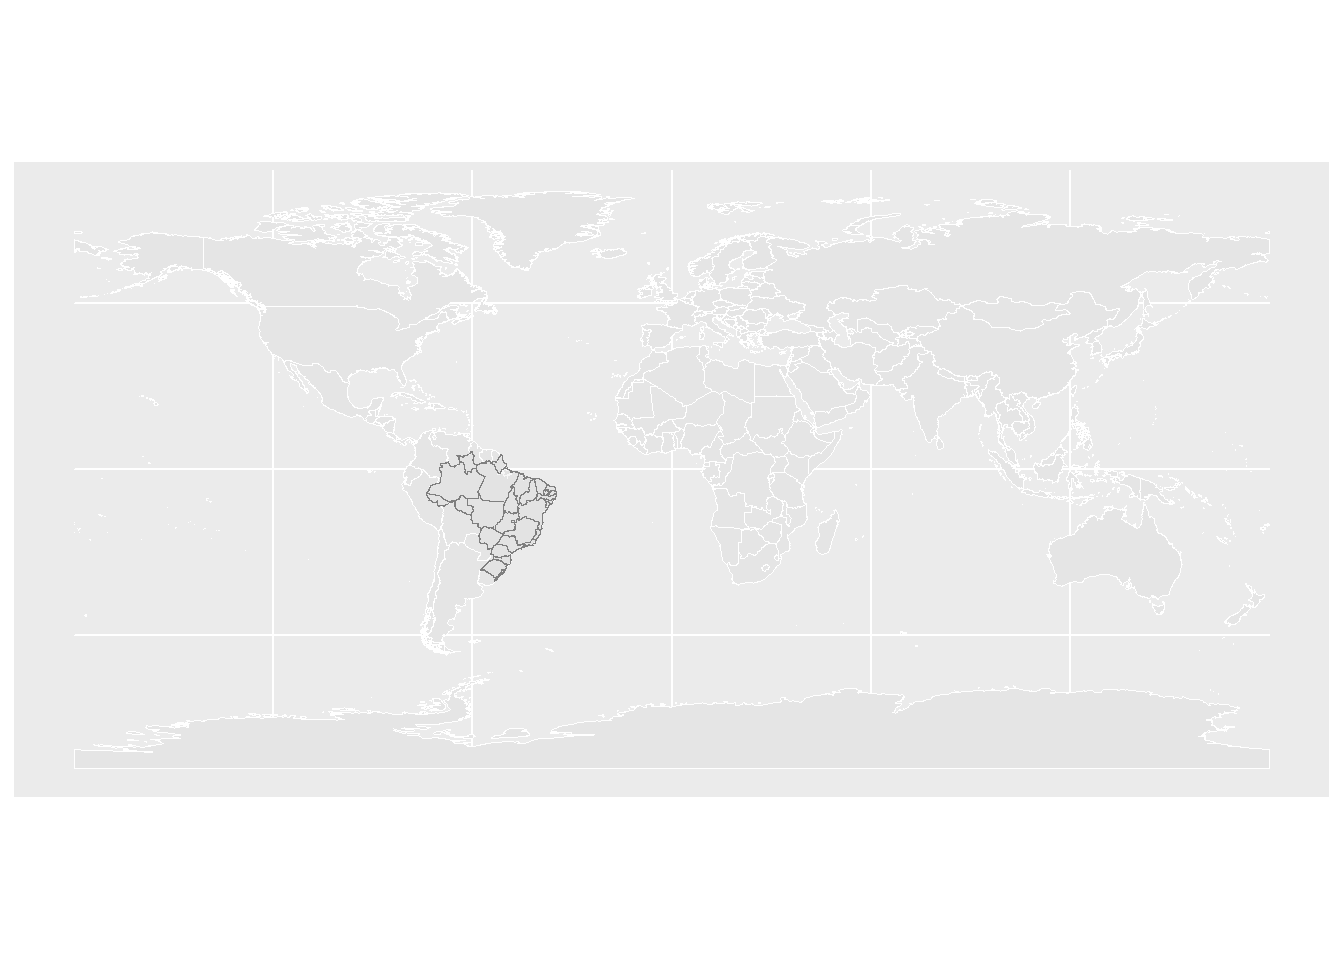
Figure 7.3: Mapa-mundi com UFs do Brasil
A terceira camada corresponde à “amazonia”, com o preenchimento da coluna “Classe”, sem contorno dos polígonos (colour = NA). As cores do potencial de agressividade (“Classe”) são preenchidas manualmente com o comando scale_fill_manual (Figura 7.4). Vamos seguir a ordem das cores como em http://geoftp.ibge.gov.br/cartas_e_mapas/mapas_regionais/sociedade_e_economia/integrado_zee_amazonia_legal/Potencial_de_Agressividade_Climatica.pdf.
ggplot() +
  geom_sf(data = mundo, colour = "white", fill = "grey90")+
geom_sf(data = UFBR, colour = "grey50", fill = "grey85", alpha = 0.2)+
geom_sf(data = amazonia, aes(fill = Classe), colour = NA)+
scale_fill_manual(values= c("A1" = "red3",
"A2" = "red1",
"M1" = "darkorange3",
"M2" = "darkorange",
"M3" = "goldenrod1",
"B1" = "chartreuse4",
"B2" = "chartreuse3",
"B3" = "chartreuse1"))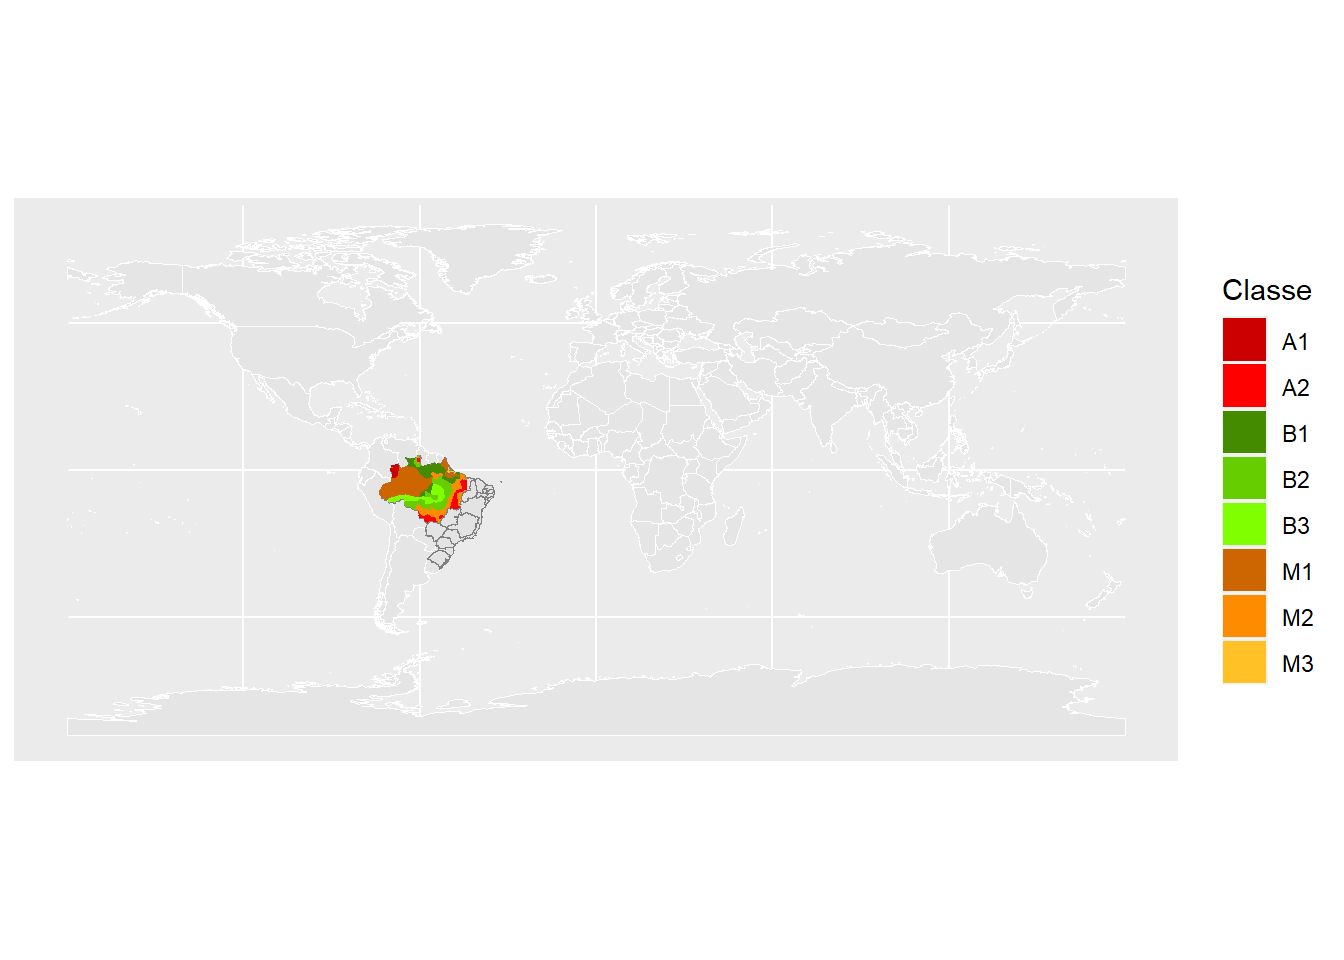
Figure 7.4: Mapa-mundi com UFs do Brasil e classes de agressividade climática da Amazônia
Observamos que o mapa resultante apresenta ordem alfabética das categorias na legenda, apesar de ter sido indicada outra ordem no código. Isso acontece porque para entender que as categorias são ordenadas, o tipo de dado deve ser factor e deve ser ordenado. Vamos verificar a classe atual da coluna ‘Classe’.
## [1] "character"A classe ‘character’ precisa ser convertida para ‘ordened factor’. Vamos convertê-la.
#para converter em 'factor' ordenado
amazonia$Classe <- as.ordered(amazonia$Classe)
#para estabelecer a ordem entre os níveis
amazonia$Classe <- ordered(amazonia$Classe, levels = c("B3", "B2", "B1", "M3", "M2", "M1", "A2", "A1"))Podemos adicionar o título do mapa, ajustar o tamanho da fonte do título, a cor do fundo, borda do mapa, título da legenda e informações adicionais como a fonte dos dados e os créditos da elaboração do mapa (Figura 7.5).
ggplot() +
  geom_sf(data = mundo, colour = "white", fill = "grey90")+
  geom_sf(data = UFBR, colour = "grey50", fill = "grey85", alpha = 0.2)+
  geom_sf(data = amazonia, aes(fill = Classe), colour = NA)+
  scale_fill_manual(values= c("A1" = "red3",
                              "A2" = "red1",
                              "M1" = "darkorange3",
                              "M2" = "darkorange",
                              "M3" = "goldenrod1",
                              "B1" = "chartreuse4",
                              "B2" = "chartreuse3",
"B3" = "chartreuse1"))+
ggtitle("Potencial de agressividade climática na Amazônia Legal")+
theme(panel.background = element_rect(fill = "aliceblue"),
plot.title = element_text(size = 11, hjust = 1, vjust = -10),
panel.border = element_rect(color = "black",linewidth = .1,fill = NA))+
labs(fill = "Potencial", caption = "Fonte: IBGE (2019) \n
Elaborado por: @Ligiaviz")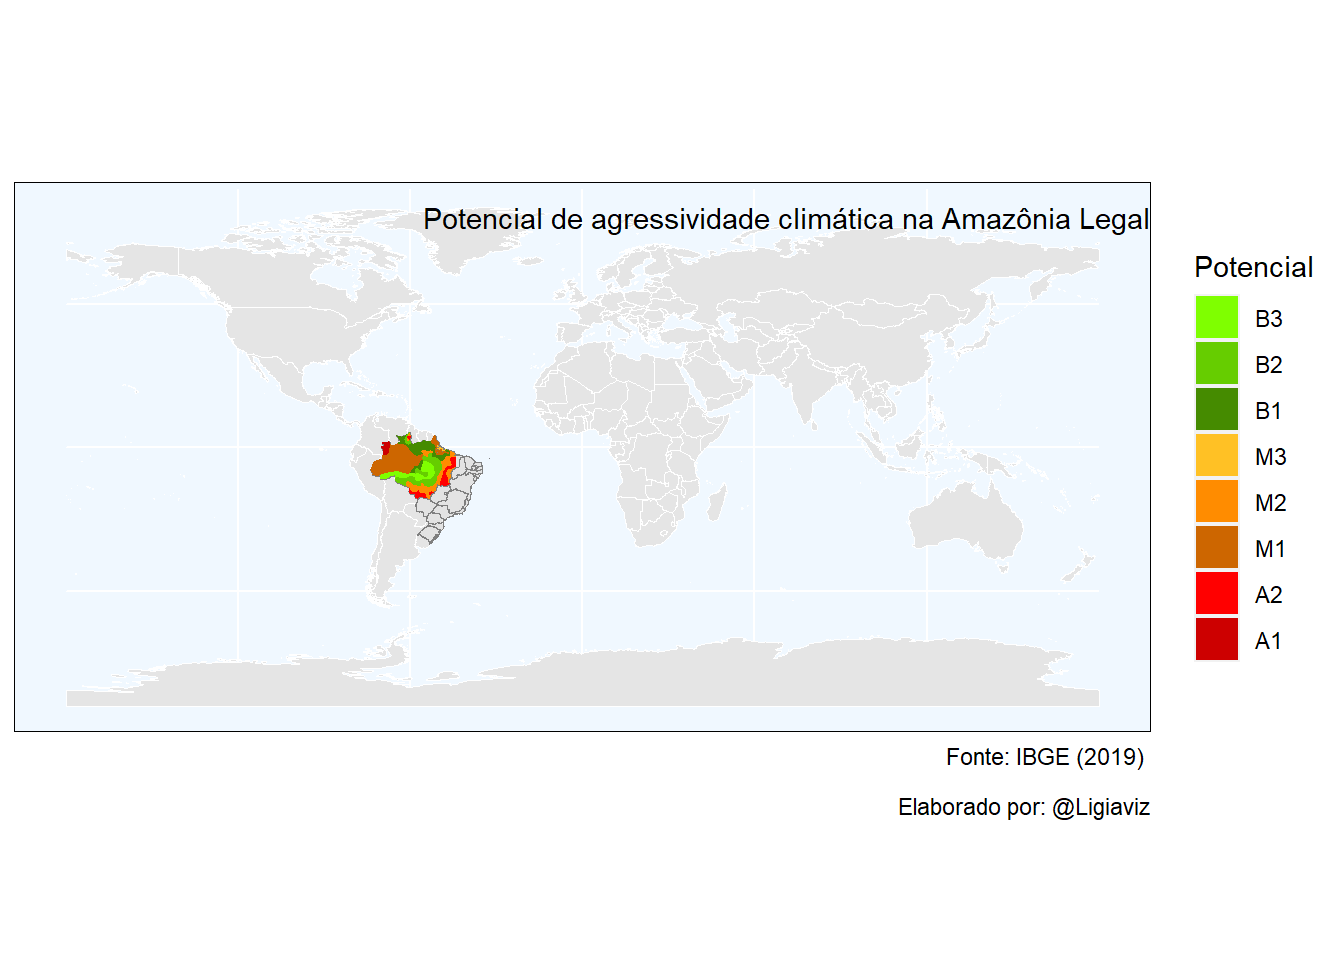
Figure 7.5: Adicionando fonte dos dados e créditos
Observe que agora a legenda segue a ordem estabelecida e não mais a ordem alfabética. Podemos também, alterar a forma como o nome da categoria aparece na legenda. No lugar de “B3” podemos nomeá-la “Baixa 3”.
#para recodificar as categorias
amazonia <- amazonia %>%
  mutate(Classe = recode(Classe,
                          # como referência: categoria antiga  = categoria nova
                          "B3" = "Baixa 3",
                          "B2"  = "Baixa 2",
                          "B1" = "Baixa 1",
                          "M3" =    "Média 3",
                          "M2" =    "Média 2",
                          "M1" = "Média 1",
                         "A2" = "Alta 2",
                         "A1" = "Alta 1"
))
unique(amazonia$Classe)
## [1] Alta 2 Média 2 Baixa 2 Baixa 3 Média 1 Baixa 1 <NA> Média 3 Alta 1
## 8 Levels: Baixa 3 < Baixa 2 < Baixa 1 < Média 3 < Média 2 < Média 1 < ... < Alta 1Ainda precisamos de outra camada dos limites das Unidades da Federação para termos ideia da distribuição do potencial de agressividade climática na Amazônia. Aproveitamos também para configurar a legenda, acertando a posição dela no mapa e a cor do fundo, assim como já deixar sem o título do eixo y.
ggplot() +
  geom_sf(data = mundo, colour = "white", fill = "grey90")+
  geom_sf(data = UFBR, colour = "grey50", fill = "grey85", alpha = 0.2)+
  geom_sf(data = amazonia, aes(fill = Classe), colour = NA)+
  scale_fill_manual(values= c("Alta 1" = "red3",
                              "Alta 2" = "red1",
                              "Média 1" = "darkorange3",
                              "Média 2" = "darkorange",
                              "Média 3" = "goldenrod1",
                              "Baixa 1" = "chartreuse4",
                              "Baixa 2" = "chartreuse3",
                              "Baixa 3" = "chartreuse1"))+
  ggtitle("Potencial de agressividade climática na Amazônia Legal")+
  theme(panel.background = element_rect(fill = "aliceblue"),
        plot.title = element_text(size = 11, hjust = 1, vjust = -10),
        panel.border = element_rect(color = "black",size = .1,fill = NA))+
  labs(fill = "Potencial", caption = "Fonte: IBGE (2019) \n
       Elaborado por: @Ligiaviz")+
  geom_sf(data = UFBR, colour = "grey50", fill = NA, alpha = 0)+
  theme(legend.position = c(0.9, 0.2),
        legend.justification = c(0.9, 0.2),
        legend.background = element_rect(colour = NA, fill = "aliceblue"),
        axis.title.y = element_blank())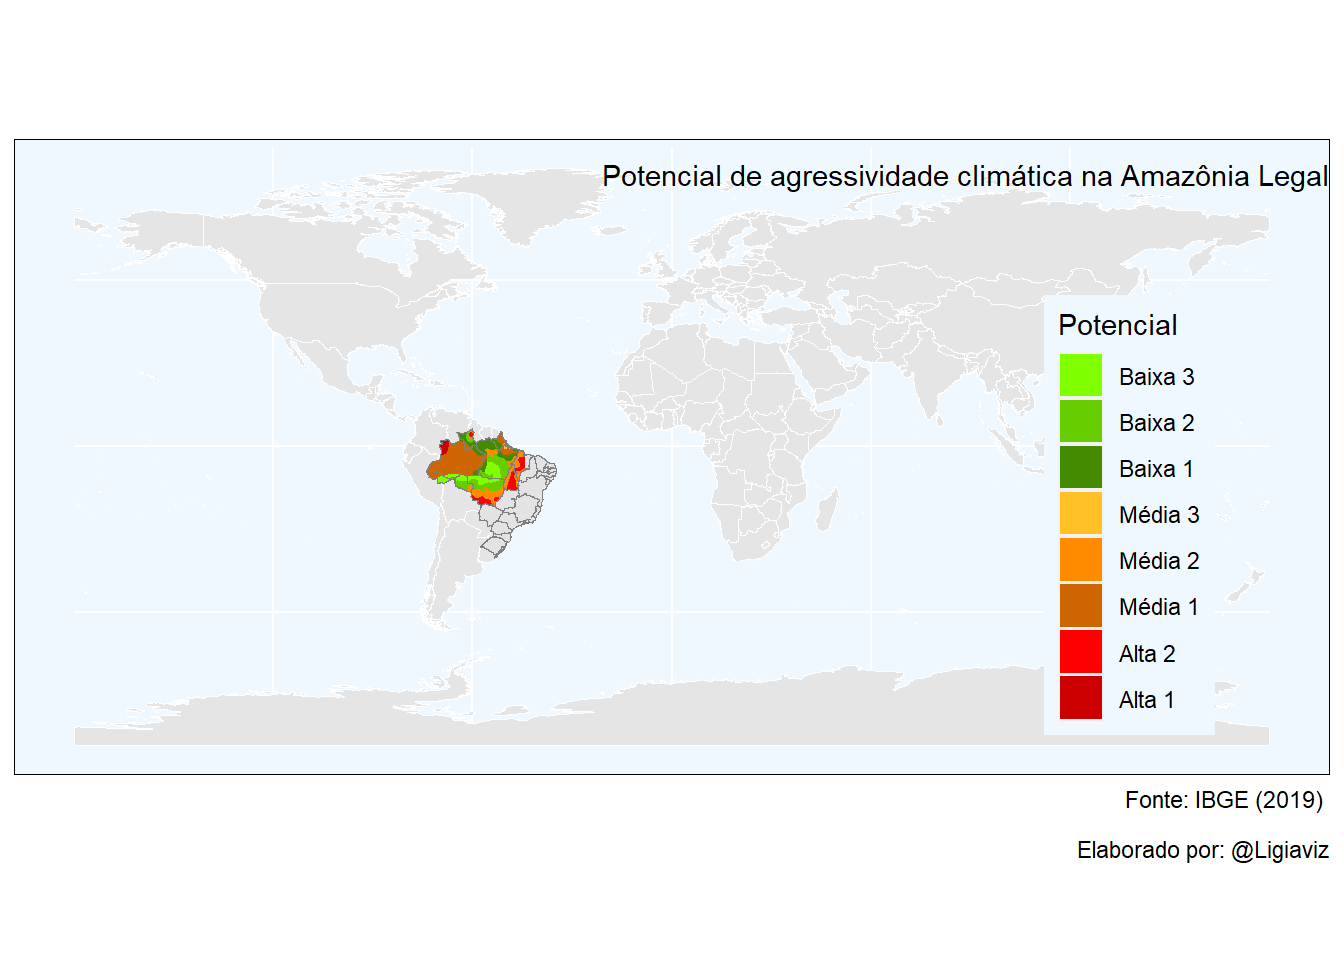
Figure 7.6: Mapa com correção da legenda e limites das UFs
A delimitação da área do mapa e outros elementos como a linha do Equador também podem ser definidos agora. A última linha do código define a escala gráfica (Figura 7.7).
ggplot() +
  geom_sf(data = mundo, colour = "white", fill = "grey90")+
  geom_sf(data = UFBR, colour = "grey50", fill = "grey85", alpha = 0.2)+
  geom_sf(data = amazonia, aes(fill = Classe), colour = NA)+
  scale_fill_manual(values= c("Alta 1" = "red3",
                              "Alta 2" = "red1",
                              "Média 1" = "darkorange3",
                              "Média 2" = "darkorange",
                              "Média 3" = "goldenrod1",
                              "Baixa 1" = "chartreuse4",
                              "Baixa 2" = "chartreuse3",
                              "Baixa 3" = "chartreuse1"))+
  ggtitle("Potencial de agressividade climática na Amazônia Legal")+
  theme(panel.background = element_rect(fill = "aliceblue"),
        plot.title = element_text(size = 11, hjust = 1, vjust = -10),
        panel.border = element_rect(color = "black",size = .1,fill = NA))+
  labs(fill = "Potencial", caption = "Fonte: IBGE (2019) \n
       Elaborado por: @Ligiaviz")+
  geom_sf(data = UFBR, colour = "grey50", fill = NA, alpha = 0)+
  theme(legend.position = c(0.9, 0.2),
        legend.justification = c(0.9, 0.2),
        legend.background = element_rect(colour = NA, fill = "aliceblue"),
        axis.title.y = element_blank())+
  coord_sf(xlim = c(-77, -24), ylim = c(-20, 7), expand = FALSE)+
  geom_hline(yintercept = 0, linetype = "dashed")+
  ggspatial::annotation_scale(location = "bl", width_hint = 0.3, line_width = 0.5, height = unit(0.1,"cm"))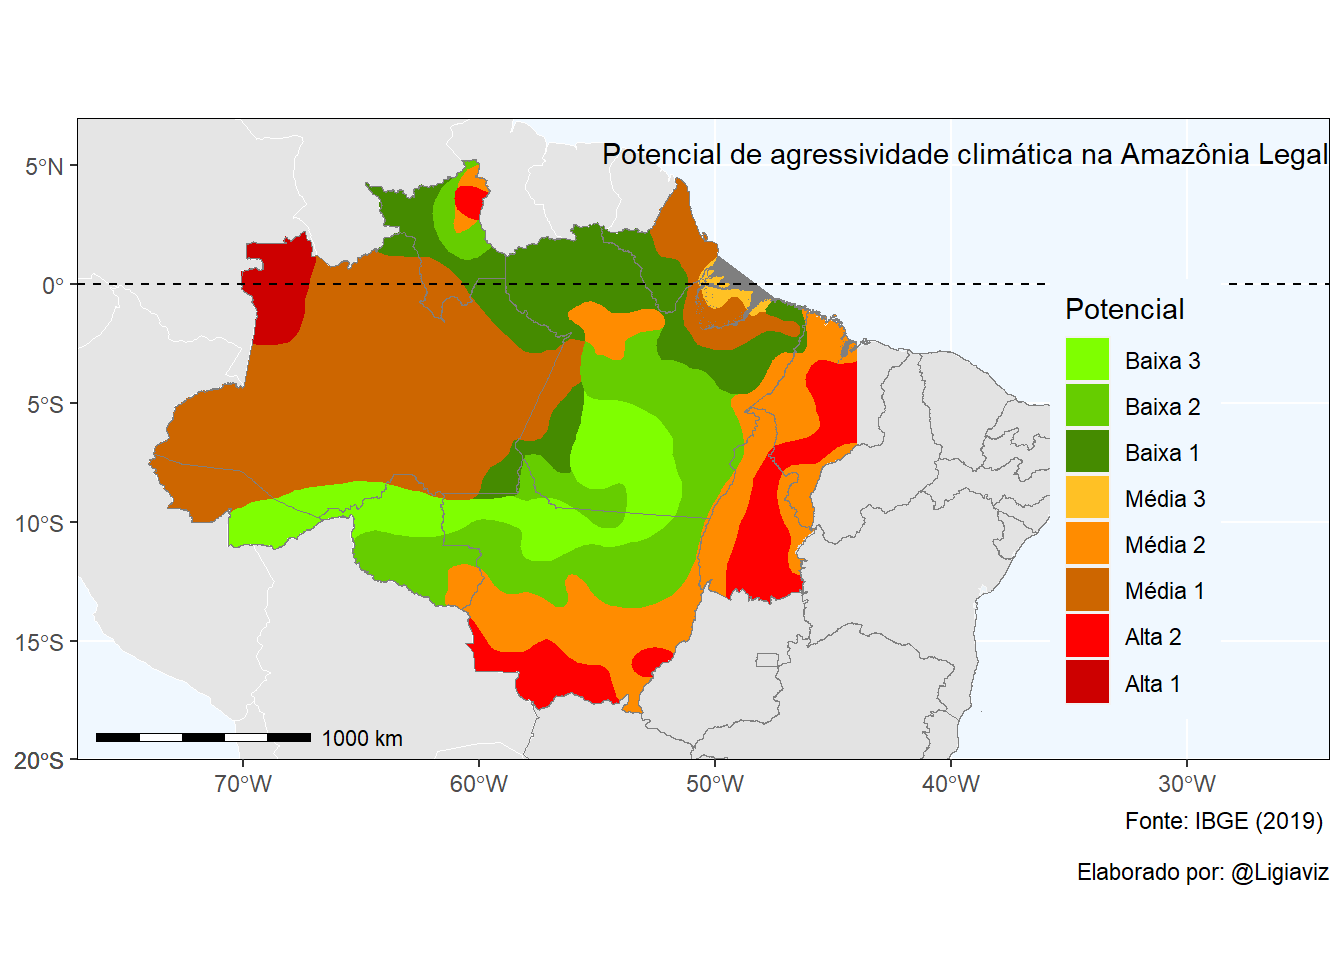
Figure 7.7: Mapa completo: recorte da área de interesse, escala gráfica e linha do Equador
Para exportar como arquivo de extensão png, usa-se o comando a seguir.